![Signals From [Space]](https://substackcdn.com/image/fetch/$s_!IXc-!,w_120,h_120,c_fill,f_webp,q_auto:good,fl_progressive:steep/https%3A%2F%2Fsubstack-post-media.s3.amazonaws.com%2Fpublic%2Fimages%2F9f7142a0-6602-495d-ab65-0e4c98cc67d4_450x450.png)
![Signals From [Space]](https://substackcdn.com/image/fetch/$s_!lBsj!,e_trim:10:white/e_trim:10:transparent/h_48,c_limit,f_auto,q_auto:good,fl_progressive:steep/https%3A%2F%2Fsubstack-post-media.s3.amazonaws.com%2Fpublic%2Fimages%2F0e0f61bc-e3f5-4f03-9c6e-5ca5da1fa095_1848x352.png)
Brief: A Closer Look at KCC PY24 Performance
A detailed look at savings, quality, and what early performance signals for kidney VBC

CMS recently released entity-level data for its third performance year of the Kidney Care Choices (KCC) Model, which took place in 2024. “PY24” is the most up-to-date look we have at how individual entities performed under the innovation center model, and it tells a more nuanced story than the headlines suggest. Quality improved broadly, and most entities generated savings against their benchmarks. With the model’s end date roughly twenty months away and a critical policy window opening this summer, this brief focuses on what the data shows, what it means, and what we’re watching next as the next generation of specialty ACOs takes shape.
What Happened in PY24
PY24 was supposed to be the KCC Model at full stride. Both cohorts were operational, the provider network had grown to over 9,200 participants, and aligned beneficiaries reached 282,335, the largest patient panel the model had covered to date. The full incentive structure was in place: the CKD Quarterly Capitation Payment, the $15,000 Kidney Transplant Bonus, and shared savings available across all risk tracks.
Figure: KCC model participation and beneficiary alignment, PY22–PY26
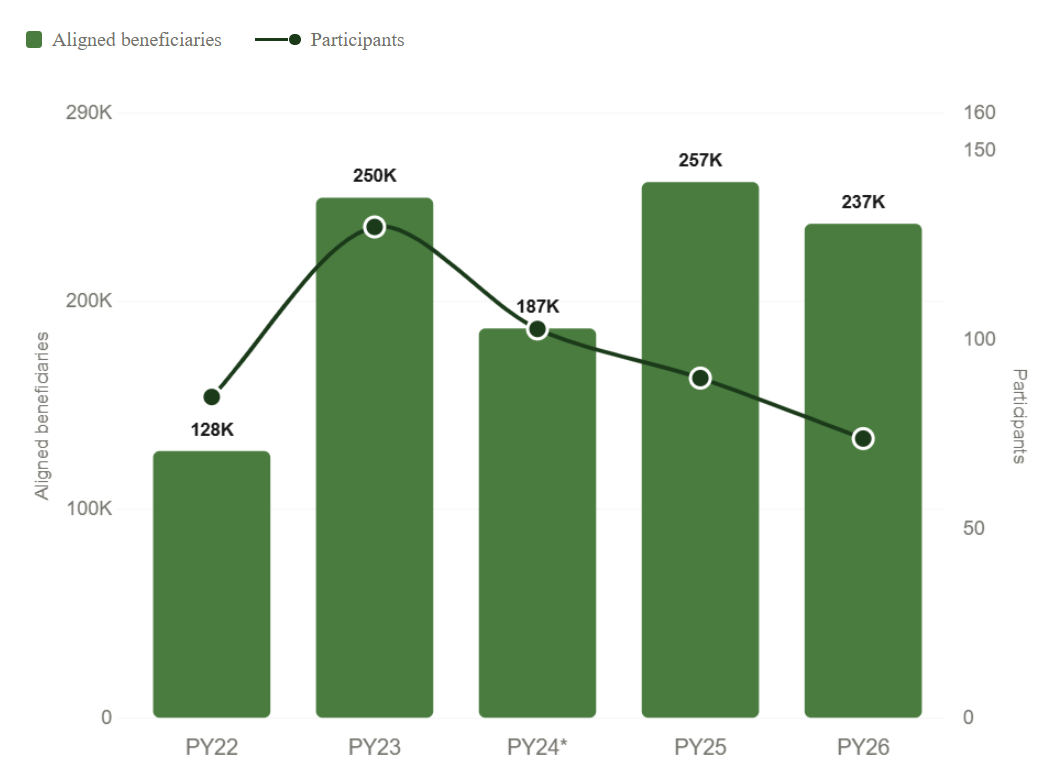
Then, after the May termination date, twenty entities exited based on participant lists provided by CMS in subsequent years.1 Effective participation dropped to 103 KCEs and 186,948 aligned beneficiaries. What makes this significant is the timing: it happened before CMS announced any changes to the model’s incentive structure. Whatever drove that decision, it was a judgment about the economics of the program and selected risk tracks for those participants.
What makes PY24 worth examining closely is that we now have entity-level reconciliation data for it. Combined with comparable PY22 data, we have a before-and-after picture of 116 unique entities operating under the model’s original financial architecture. Signals assembled this dataset from publicly available CMS reconciliation files. It is the most granular look we will have at how the model performed when fully funded and incented, and we think it warrants synthesis, analysis, and discussion.
Reading between the lines
The headline most people know is that the KCC Model cost Medicare roughly $304 million in net losses in PY23. That number is important, but it’s only part of the larger story, as I've shared before. The breakdown of where that $304.8M actually went tells a different story than the headline suggests. When you look beneath it at what individual entities actually did: how they performed against their benchmarks, how quality scores moved, how the cohorts compared, the picture is far more complete and compelling.
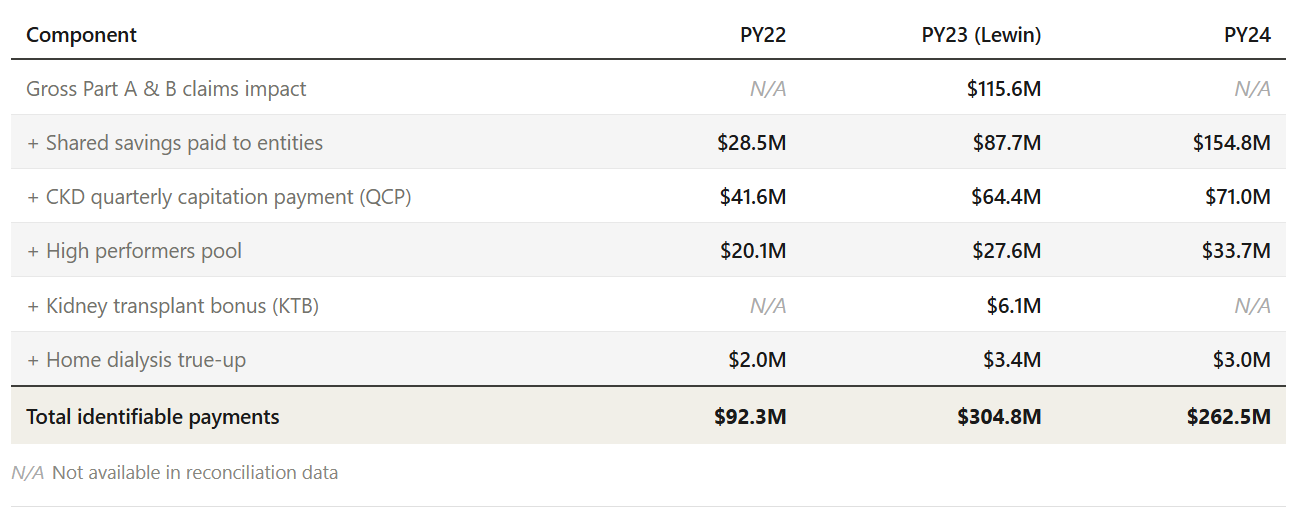
Table: How Medicare calculates net KCC spend (PY23)
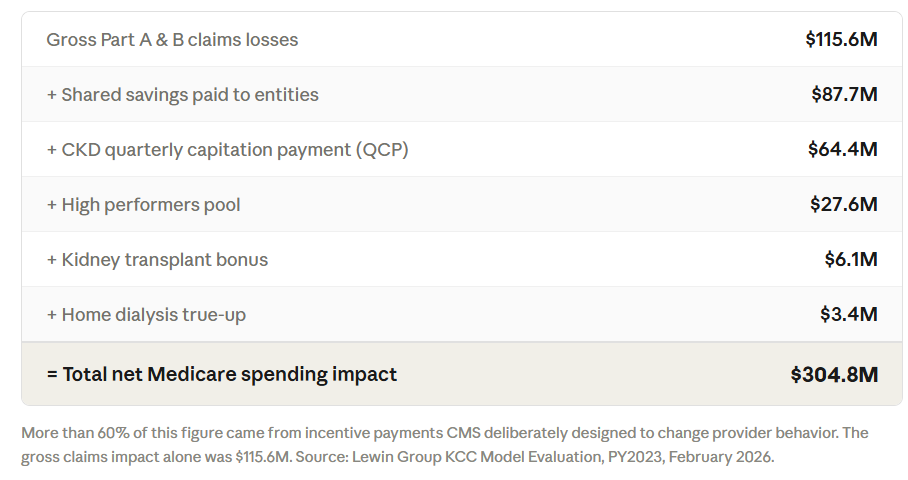
Let’s start with the math behind that $304M figure. The Lewin Group’s PY23 evaluation showed that more than 60% of that loss came from the incentive payments themselves - that’s the QCP, shared savings distributions, transplant bonuses, and high performers pool. These weren’t wasteful spending, they were what CMS deliberately designed to change behavior, and they did. The gross Part A&B claims impact was $115.6M. Significant, yes, but a different story than the net headline. Most of the “losses” in the headline number were planned incentives from CMS, not overspending by providers. In other words, CMS paid providers to change behavior, and those payments show up as “losses” in the program-level accounting.
The chart below shows how those components stack up across PY22, PY23, and PY24. In PY23, the hatched green bar drops below zero, that is the claims impact, not a savings figure. In PY22 and PY24, the solid green bars represent gross savings generated by entities against their benchmarks.
Figure: KCC model financial performance, PY22–PY24
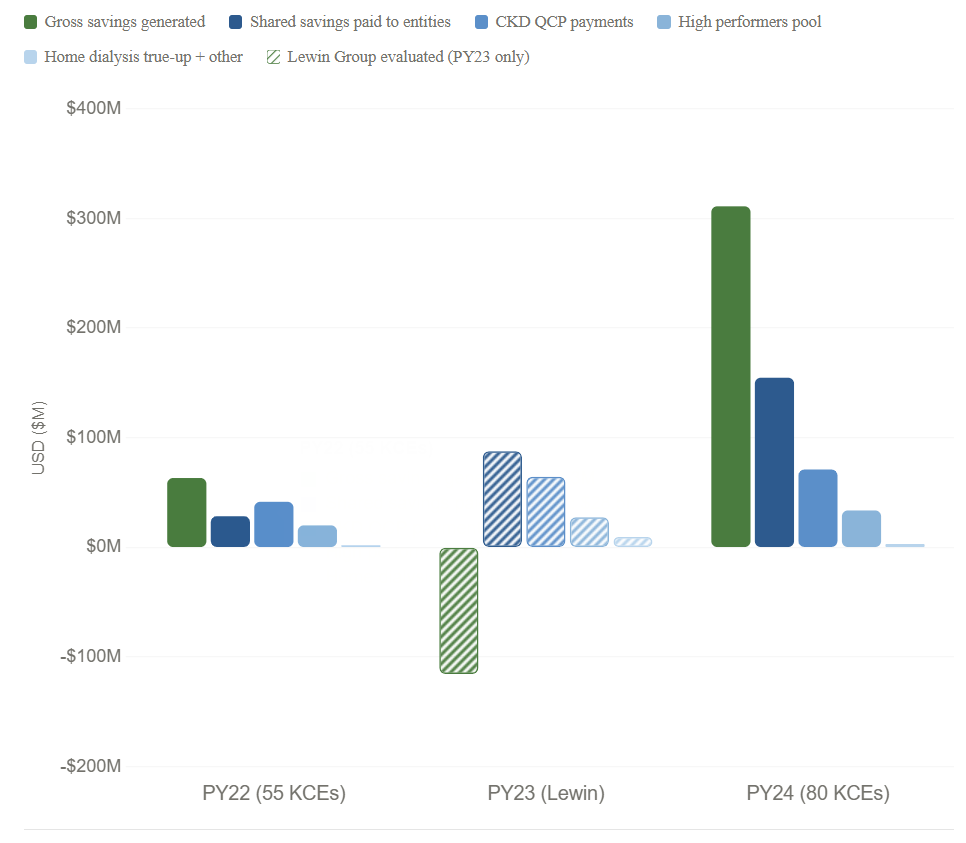
The PY24 reconciliation data adds another layer. The 80 KCEs active in PY24 generated $311 million in gross savings against their risk-adjusted benchmarks, nearly five times the $63 million generated by 55 KCEs in PY22, and a ~3x jump in gross savings rate from 1.2% to 3.6% of benchmark. That trajectory matters, and it may be one of the clearest signals this model is working as intended.2
At the entity level, 67 of 80 KCEs generated positive net savings in PY24. That’s 84% of the shared-risk entities in the model, at a mean savings rate of 1.9% of benchmark. The Cohort 1 entities, two full years in, averaged 2.0% with 40 of 45 in positive territory. The Cohort 2 entities, in just their second year, averaged 1.8% with 27 of 35 positive. A gap of less than a quarter point between experienced and newer participants is not a steep learning curve. It suggests the model's financial logic is fairly accessible once the infrastructure is in place.
Performance varied by affiliated organization in ways that are worth examining closely, both for what improved and for what the patterns might suggest about different approaches to building sustainable kidney VBC infrastructure. Here is where things stood for Cohort 1 entities with data in both years:
Table: Top 10 Entities by Gross Savings ($) and Net Savings (%)
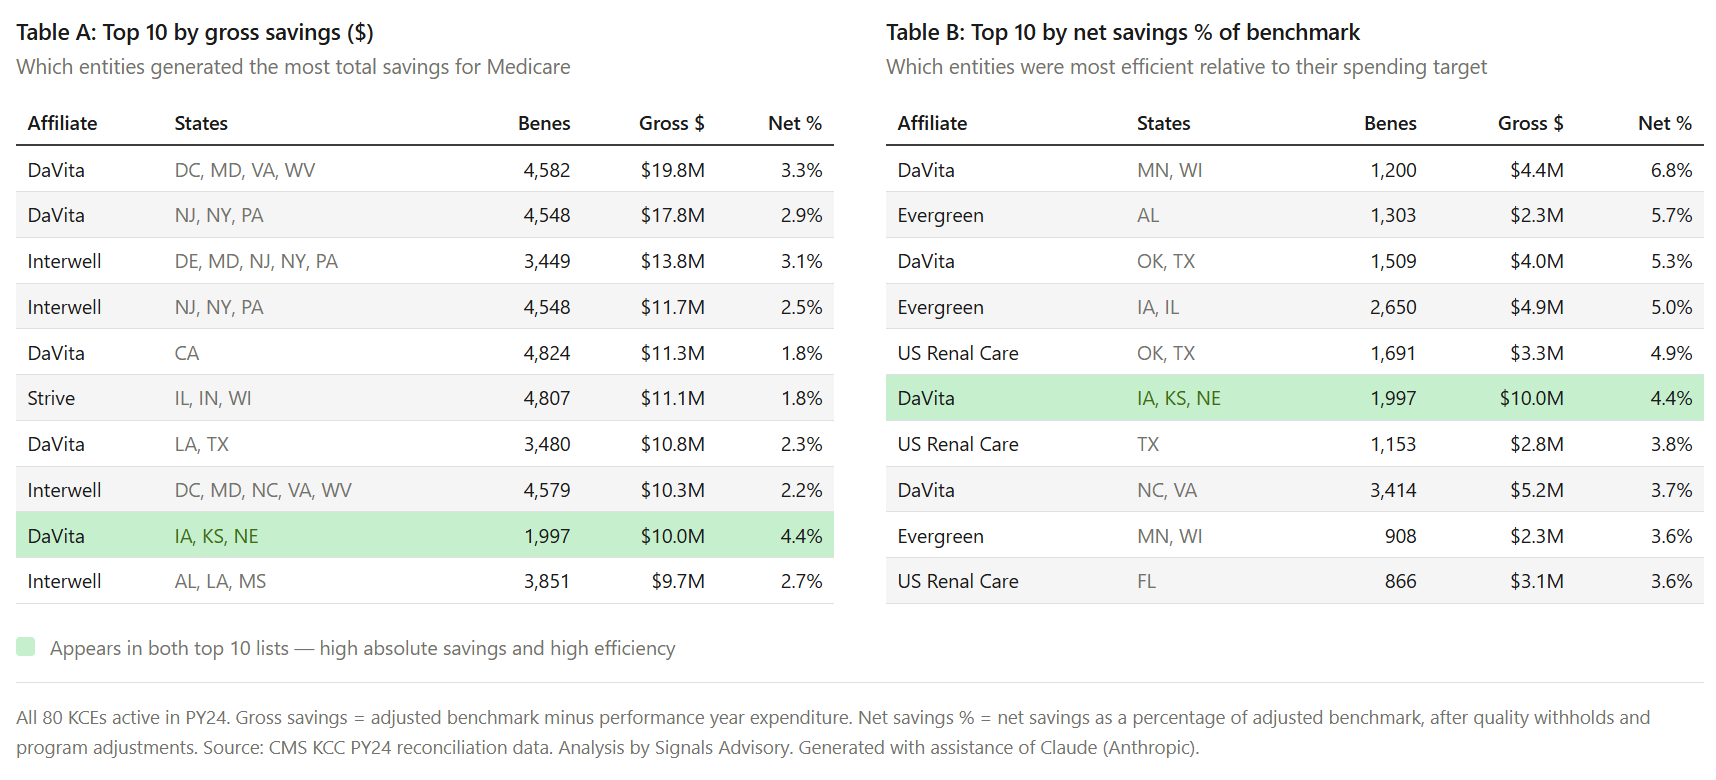
A few observations stand out. Interwell entered PY24 with the strongest quality scores and held them. DaVita showed meaningful improvement on both quality and savings. DCI improved substantially on quality scores across all three of its entities, with one achieving a perfect score by PY24 and earning recognition in the high performers pool. US Renal Care had the highest net savings rate in PY24, a trajectory of improvement that raises good questions about what changed operationally and what others can learn from it. In my view, these are the kinds of patterns worth tracking as PY25 data eventually becomes available. Behind these numbers are hard won lessons from delivering care locally.
Among top performers clearing 3.6% of benchmark in PY24, DaVita accounted for four entries, with Evergreen and US Renal Care each contributing two. On quality, Interwell led with five entities scoring in the top decile. The two measures don’t always travel together, and that gap is worth watching as the field matures. One exception is worth calling out. The green-highlighted entity appearing in both tables operates across Iowa, Kansas, and Nebraska. With roughly 2,000 aligned beneficiaries, a quality score of 85%, $10 million in gross savings, and a net savings rate of 4.4% of benchmark, it was among the model's top performers on both dimensions in PY24. And it did so in its second year of participation.
Taken together, these patterns suggest there isn’t a single path to success in kidney VBC. Some organizations are winning through care infrastructure and consistency. Others are improving through their scale and iteration cycles. And a few appear to be unlocking step-changes in performance that aren’t yet fully understood. As more data becomes available, the key question won’t just be who performed best, but which of these approaches proves most durable under changing incentives.
One thing worth dwelling on before we move to the policy picture: kidney care VBC is uniquely challenging compared to many other risk-bearing models, especially those further upstream where patient panels are large and risk tends to average out. These specialty ACO entities are managing populations defined by advanced, multimorbid disease. A single patient progressing from CKD Stage 5 to ESRD mid-year, or a cluster of high-cost hospitalizations in one quarter, can move a small entity’s financials materially. Risk adjustment helps, but those swings matter for KCEs and the patients they serve. Comparing a 500-beneficiary independent practice in rural Mississippi to a 3,000-beneficiary entity in metropolitan Texas on a single savings percentage misses most of what is actually happening. I’m consistently impressed by what these practices are doing on the ground: managing extraordinarily complex patients in a new payment paradigm while still generating measurable savings. That context is important to keep in mind when reading these numbers.
We need to talk about hospitalizations
There is one metric worth addressing honestly: hospitalizations. Reducing those costs is a central quality mandate of the model, and it is a downstream outcome that would most clearly validate the long-term investment thesis, alongside reducing total cost of care and increasing optimal starts.3 We don’t have claims data here. What we do have is the Lewin Group’s PY23 evaluation, which found no statistically significant impact on hospitalizations, readmissions, or emergency department visits.
That finding deserves context rather than alarm. The clinical investments the model drove upstream are exactly the kind of interventions that should reduce acute care events over time.4 We saw a 31% increase in optimal ESRD starts, 10% more home dialysis use, a 69% jump in preemptive transplants, and 29% fewer hemodialysis catheters. Each of these is significant on its own, and together they’re a strong positive signal. The PY24 financial data suggests those investments are beginning to translate into measurable cost management, even before seeing hospitalization trends. The open question is whether reducing the QCP and eliminating the transplant bonus will slow the clinical progress that was supposed to produce those reductions in the first place. You cannot cut the upstream investment and expect the downstream savings to show up on schedule, if at all.
Why this timing matters
In May 2025, CMS announced a set of changes to the KCC Model effective in 2026. These included a 50% cut to the CKD QCP and elimination of the Kidney Transplant Bonus. Benchmark discounts of 1% were added for both the Professional and Global tracks. The KCF option was terminated a year early. The CKCC options were extended through 2027, but under this restructured design. Everything is a balancing act: CMS needs to experiment with model incentives to find sustainable ways to drive down costs, while model participants need incentives to finance and scale care models that deliver better outcomes. That is why the CMS innovation center exists, and it’s also why more than $2 billion in private capital has flowed into value-based kidney care models in recent years.
PY24 and PY25 were the last two years in which the model operated under its original incentive architecture. Since PY25 entity data is not yet public, PY24 is the last complete picture we have of what the model looked like when fully funded under this incentive design structure. The participation trajectory makes this sharper: from 130 entities at peak in PY23 to 74 in PY26, a 43% decline over three years, all happening while clinical outcomes were improving. The entities that remain built infrastructure and scale needed to continue growing. With over 1.5 million lives and nearly $40 billion in medical spend under management, the kidney VBC entities have grown well beyond the ~237,000 beneficiaries currently aligned to the KCC model. The question most operators are sitting with now is this: how do we plan for what comes next, and how do we sustain what we've built until we know?
What we’re watching now
July 2026 marks roughly 18 months from the model’s current end date. That is historically the window in which CMS signals what comes next, whether that means a successor model, a certification pathway, or a sunset.
Figure: KCC incentive payment components, PY22–PY245
Here is what we will be watching:
What will a full PY24 evaluation show? The reconciliation data tells us what entities recorded. A Lewin-style evaluation would tell us what the model actually caused, including whether hospitalizations finally moved and whether the savings are there. That distinction matters enormously for what CMS decides to do next.
Can entities sustain care coordination infrastructure under reduced incentives? The QCP funded the coordinators, navigators, and modality educators that drove quality gains. A 50% cut is steep, so time will tell whether clinical progress holds or erodes.
What happens to transplant access in future innovation center models? The KTB is gone and the IOTA model shifts focus to transplant hospitals rather than the nephrologists who identify and navigate transplant-eligible patients. It’s hard to run a controlled experiment in the “real” world, so keep an eye on both models.
How does MA growth change the calculus? Several organizations in KCC are running parallel MA-based kidney care strategies. For many, it’s their primary growth strategy. While federal APMs set the tone for private payer alignment, MA operates under different constraints. How organizations navigate those tradeoffs while chasing what remains a large pool of unmanaged spend will be worth watching.
What does consolidation look like from here? The model has an end date. Capital raised by kidney VBC organizations over the past several years is maturing, investment timelines are tightening, and the public markets are watching what companies like Omada, Hinge, and Virta demonstrate about the tech-enabled path to scale and profitability.6 I’d wager the dozen or so organizations operating in this space will look a bit different in 18 to 24 months.
Final thoughts
We are still working through the details, and a full PY24 evaluation will add important context if and when it arrives. We don’t yet know whether CMS plans a KCC 2.0, a certification pathway, or something else entirely. We expect the second half of this year to tell us a great deal. In the meantime, PY24 is the most complete picture available of what this model produced under the conditions it was designed for.
Based on the information we have, PY24 suggests the model can work. The question now is whether the system has what it needs to continue funding the next generation of accountable care.
We’d like to hear what you’re seeing. If you’re operating in this model, what are we getting right, what are we missing, and what should others know as they interpret these results?
###

Signals Advisory built a full entity-level year-over-year tracker covering PY22 and PY24 KCC reconciliation data: 116 unique entities, 35 metrics, and the financial and quality trends underlying the findings in this brief. It is part of our broader value-based kidney care research offering, which tracks more than 1.5 million lives and nearly $40 billion in medical spend under management across the kidney VBC landscape. Available to operators, startups, industry, investors, and those looking to go deeper on these topics.
Notice of PY 2026 Participants for the Kidney Care Choices (KCC) Model:
https://www.cms.gov/priorities/innovation/files/kcc-model-participants-cy2026.pdf
These figures are drawn from the CMS PY22 and PY24 KCC reconciliation datasets and reflect CKCC entities only. Identifiable incentive payments in the PY24 data, including shared savings distributions, CKD QCP payments, the high performers pool, and the home dialysis true-up, total approximately $263 million. A full program-level accounting comparable to the Lewin Group's PY23 evaluation would require layering in KCF payments, the kidney transplant bonus, and gross Part A&B payment impacts, which fall outside the scope of the reconciliation data. Signals has not attempted that reconciliation here.
Optimal starts defined as “The percentage of new ESRD patients…who experience a planned start of renal replacement therapy by receiving a preemptive kidney transplant, by initiating home dialysis, or by initiating outpatient in-center hemodialysis via arteriovenous fistula or arteriovenous graft.”
Kidney Care Choices (KCC) Model RFA (2019):
https://www.cms.gov/priorities/innovation/files/x/kcc-rfa.pdf
Kidney Care Choices (KCC) Model, Second Annual Evaluation Report - Performance year 2023, Page 22 (Lewin Group): https://www.cms.gov/priorities/innovation/data-and-reports/2026/kcc-2nd-annual-report
It’s worth noting these figures are not directly comparable across years. For example, ‘Total Monies Owed By (To) CMS’ in the reconciliation data reflects the net settlement figure after withholds and offsets, and differs from the gross incentive payment total shown here. Lewin data (PY23) includes 100 KCEs, 30 KCF practices.
On the digital health IPO landscape and public market comps:
https://firstmark.com/story/hinge-omada-and-the-future-of-digital-health/
Hi Tim, interested in the 10% growth in home dialysis. Any details on where the growth occurred and modality choice (PD vs. HHD). We might link this with improvements in optimal starts, ie, patients get to see/learn about all modality options and can be proactive about making their own choices.
Overall, this doesn't make VBC in the renal care side look favorable enough to continue. But the jury is still out deliberating.